
Actual Before/After Patient Results
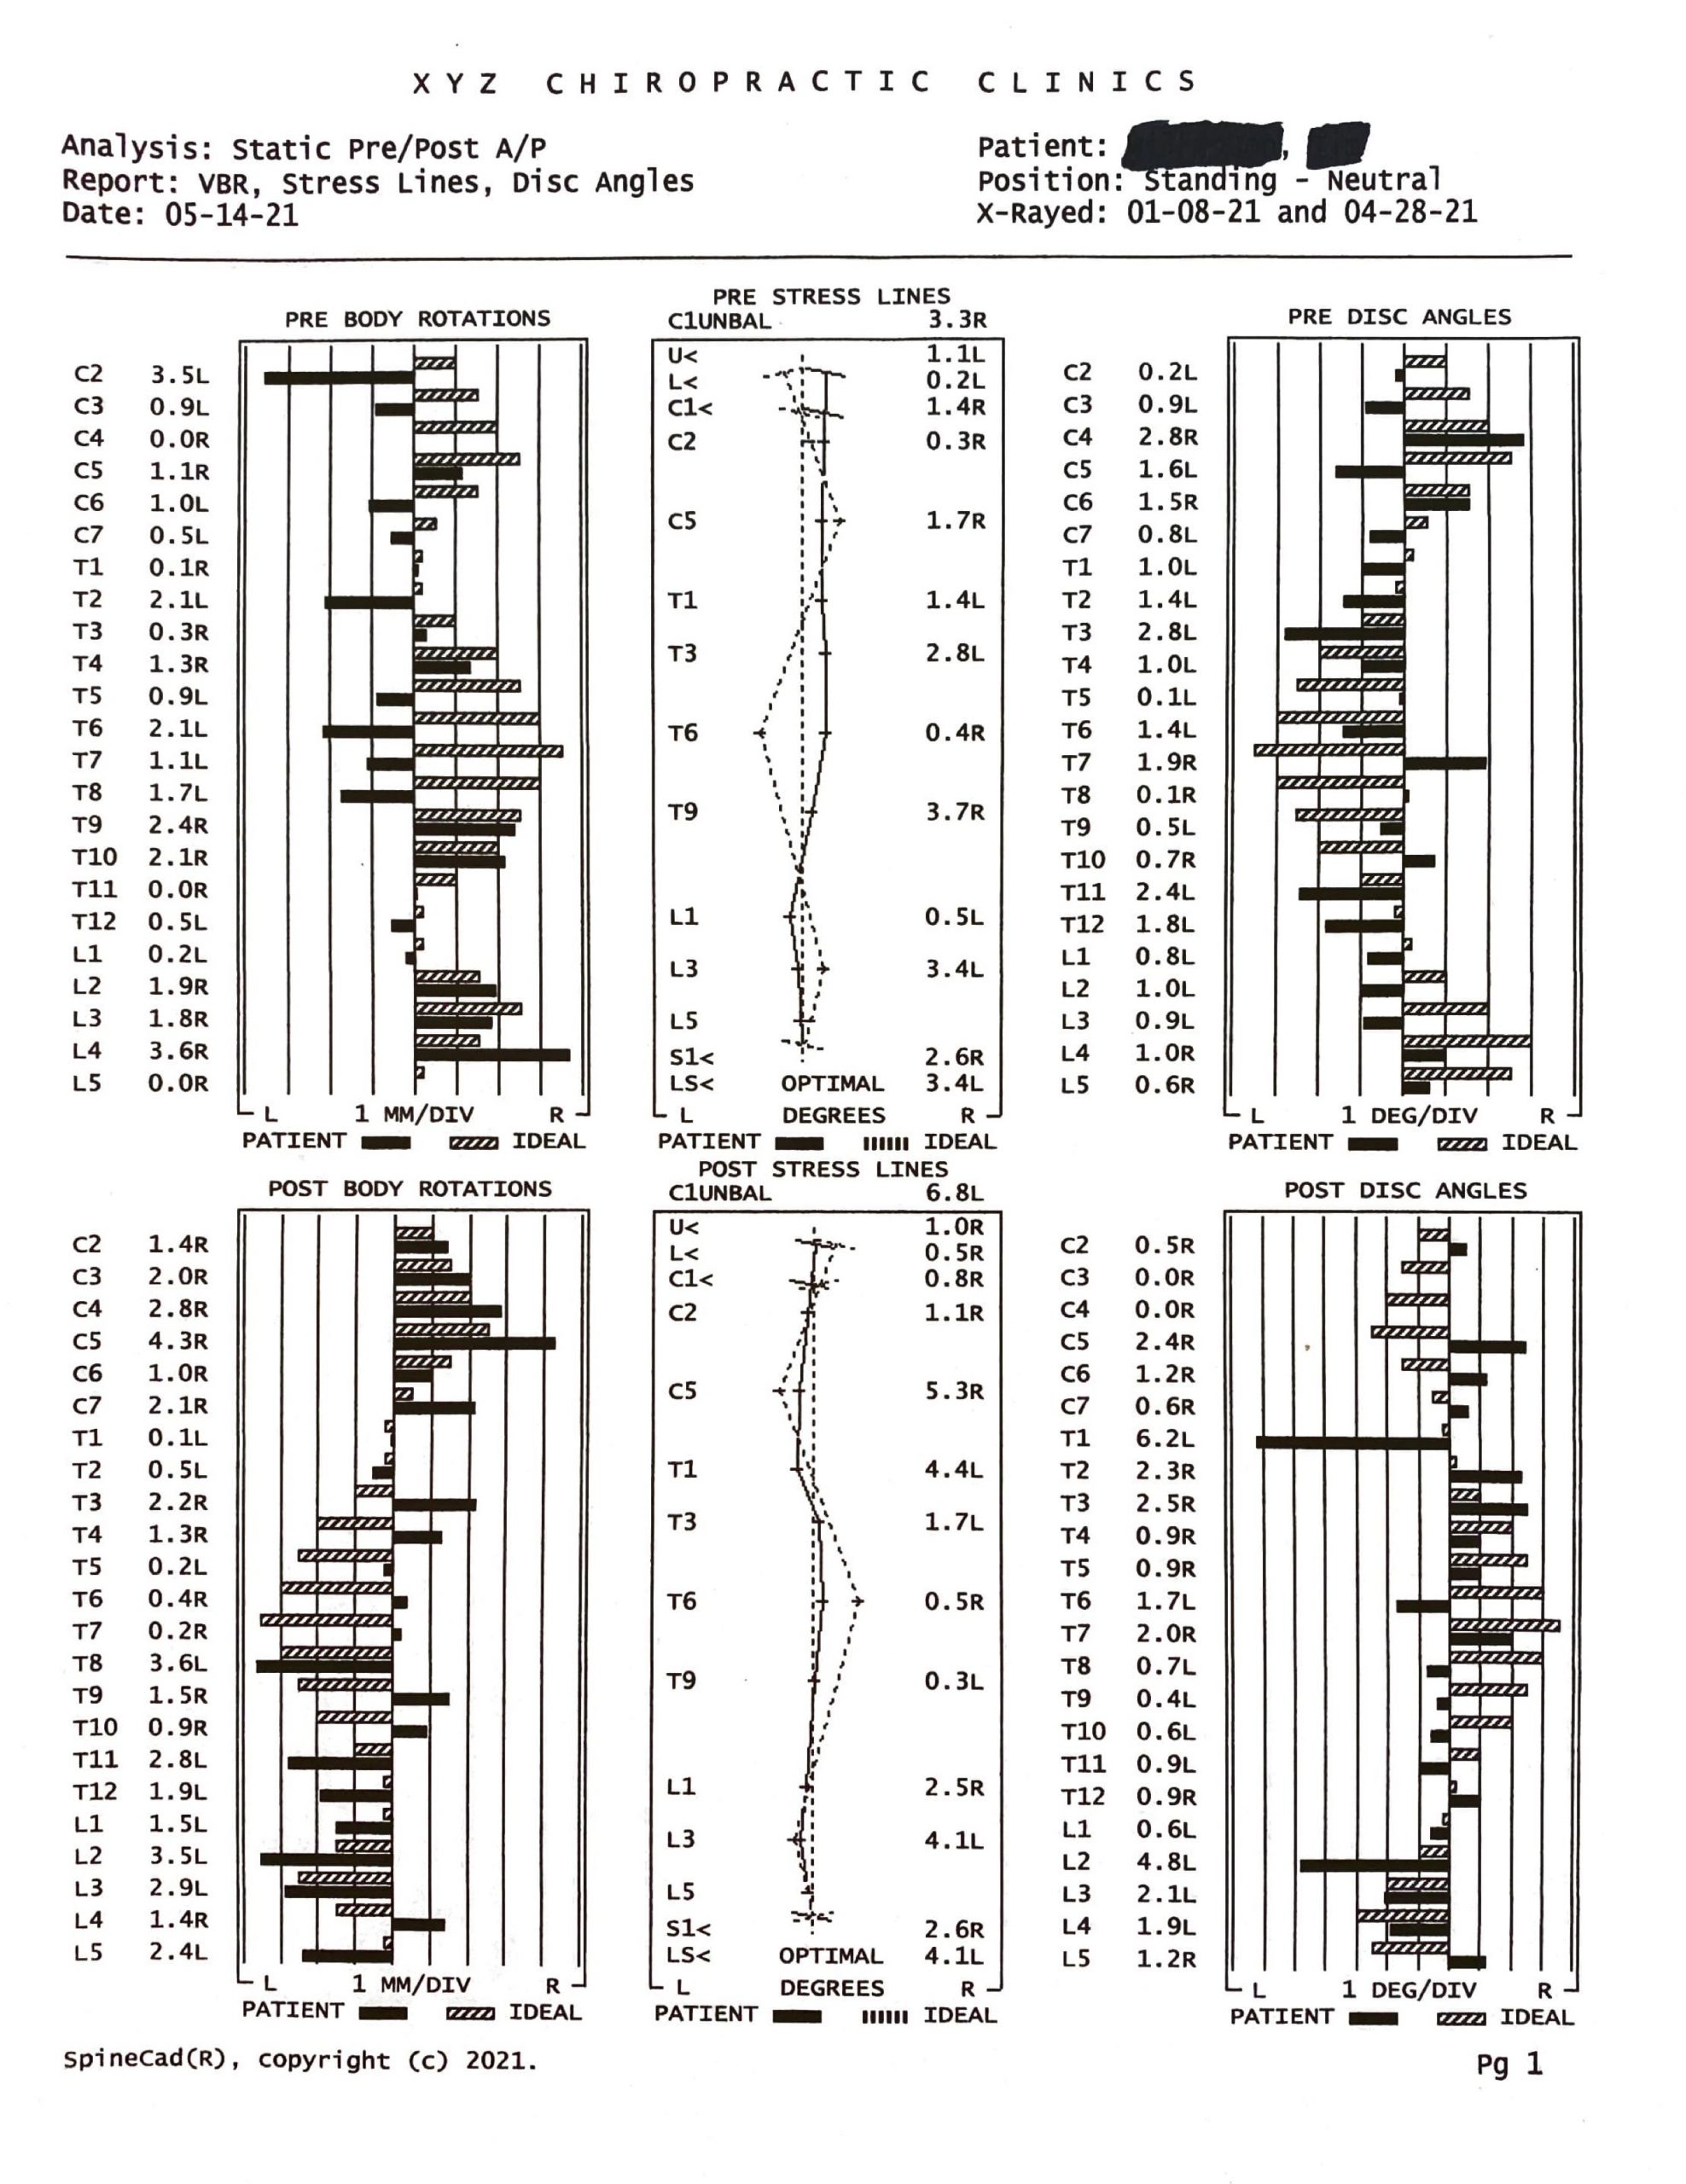
To understand the results of the biomechanical analysis, we need to understand what the boxes mean. The box in the upper left shows the rotations of the vertebrae of the spine. The dashed lines represent what the rotations should show in an ideal spine. The video below explains a bit more in depth, but we should see more rotation in the middle portions of each section of the spine (cervical, thoracic, and lumbar). The dark black lines are the rotations actually seen in the patient. So the upper left box shows the patient before treatment, and the lower left box shows the patient after treatment.
When we look at these results, we are looking less for things to match up perfectly with their ideal positions and more for things to mimic the PATTERN of an ideal spine. So as we look at these results, we see that the patient recovered the complete motion pattern of the neck, but we are still seeing some issues present in the upper portion of the mid back where the vertebrae are still rotating the wrong way. We also see an abnormal wrong sided rotation at L4 not fitting the pattern of the patient’s spine.
The middle box represents the stress lines of the spine. Again, see the video below for more information, but these represent the normal sagittal curves of the spine (normal front to back curves of the spine that account for posture) being projected into the AP (front to back) view. We should see the curves peak at C5, T6, and L3 because these are the middle parts of the sagittal curves. Since the middle portion of the curve is what bears the most stress we refer to these points as stressed points that are denoted with stress lines. Again we look for the pattern to mimic the ideal pattern. It does not have to conform exactly to the ideal pattern. As we see in the top pre stress line analysis, the patient showed an abnormal L1 stress line where the black line (the patient) diverges from the dashed line (the ideal spine), another abnormal stress line at T6 where the patient and the ideal stress lines diverge, and a straight neck stress line which indicates (in this case as we see from the lateral side view xray) no curvature of the neck. In the after treatment analysis, we see stress line pattern conforming at L3 (which is proper), T6 which is again proper, and C5 which is again proper for the stress lines. We do see a more clearly defined abnormality between T1 and T3 on the post xray. This fits with the abnormal rotations we see in the vertebral rotation study.
We no longer pay much attention to the disc angles (the boxes on the right) as we have found them to be unreliable although there can sometimes be some valuable information found in the lumbar spine where the disc angle analysis tends to be more accurate.
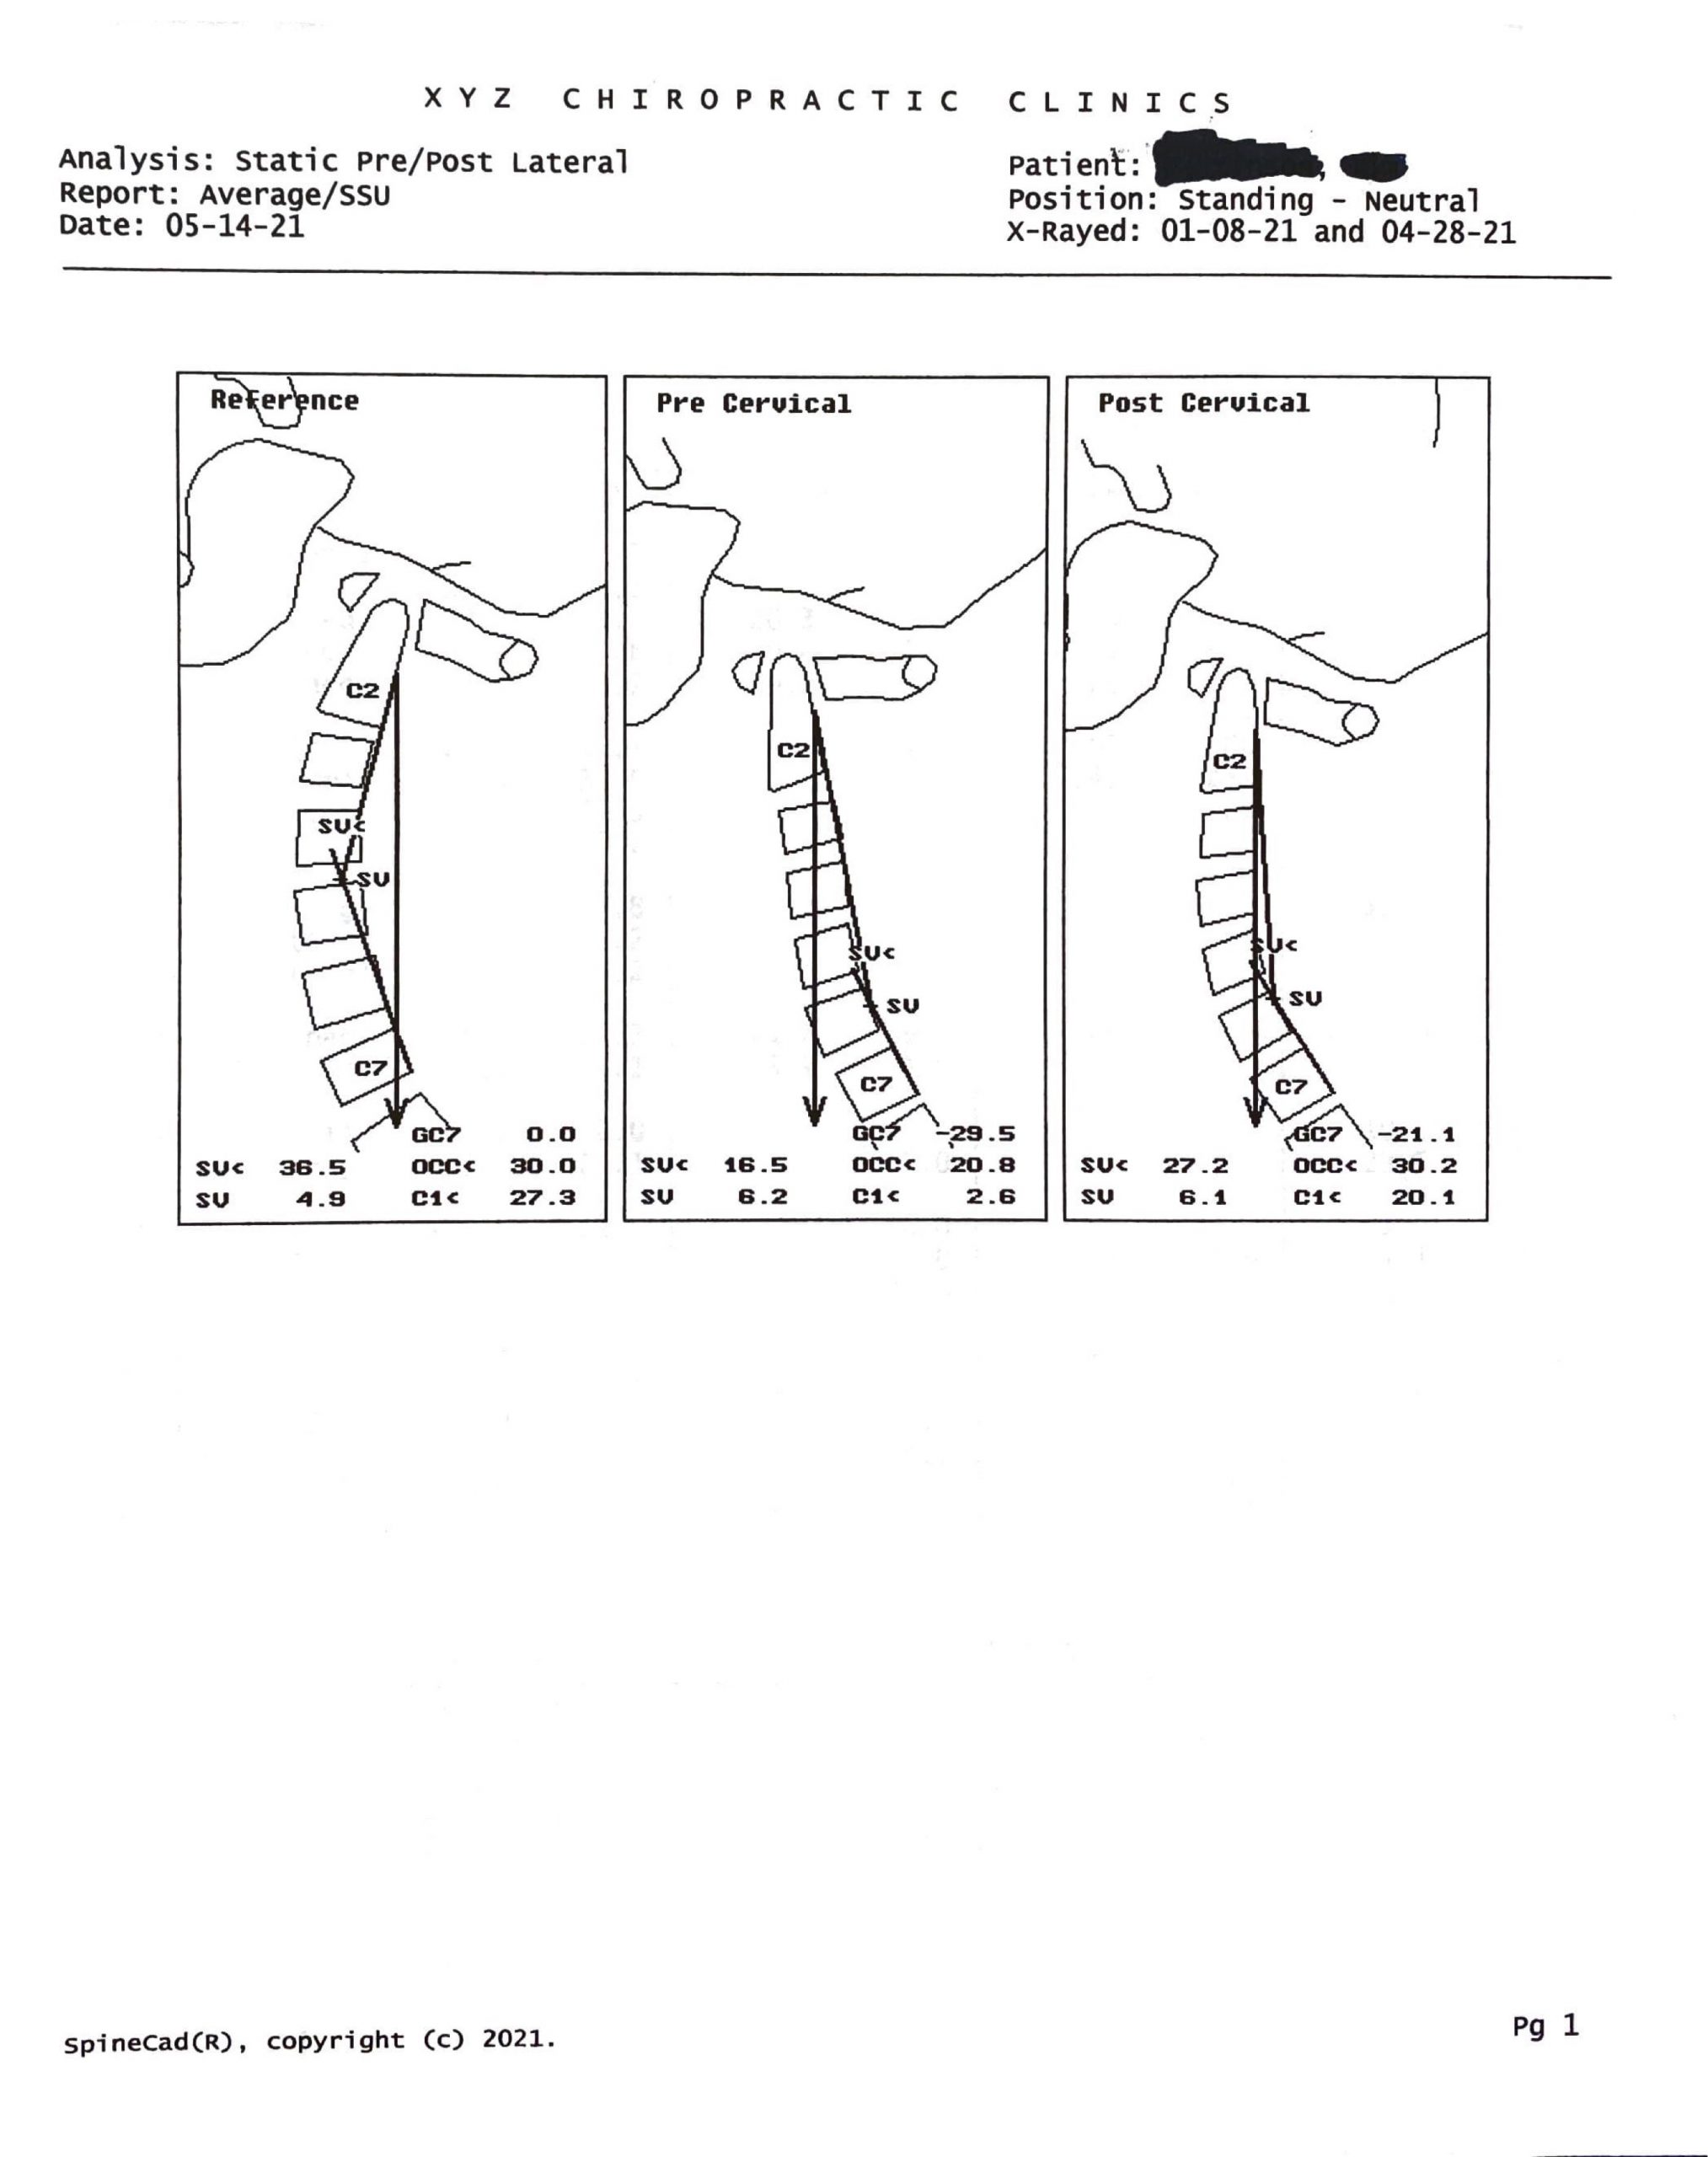
When we look at the pictures of the neck below of the neck from the side (lateral view), the first picture shows a reference neck with reference measurements. The second neck is the pre-treatment neck, and the third neck is the post treatment neck. If we look at the reference neck, we will see that the stressed vertebra angle (SV<) is 36.5 degrees. For all intents and purposes this is the angle of the curve of the neck. The stressed vertebra is 4.9 or essentially the disc space between C4 and C5. The gravity line at C7 is 0.0 where the weight of the head is transferred from the posterior body of C2 down to the top posterior corner of C7. This weight bearing configuration will emphasize the proper joint function of the facet joints (the guide joints on the back of each vertebra) and curvature of the neck. The occipital angle (occ<) is the angle that the occiput (skull) rests on C1 from the horizontal. The normal angle is 30 degrees. The angle of C1 (C1<) represents a line drawn through C1 from anterior to posterior from the horizontal. The normal angle of C1 is 27.3 degrees.
Dr. Seth Black
Phone: 573-885-2003
501 South Franklin Street, Cuba, MO 65453